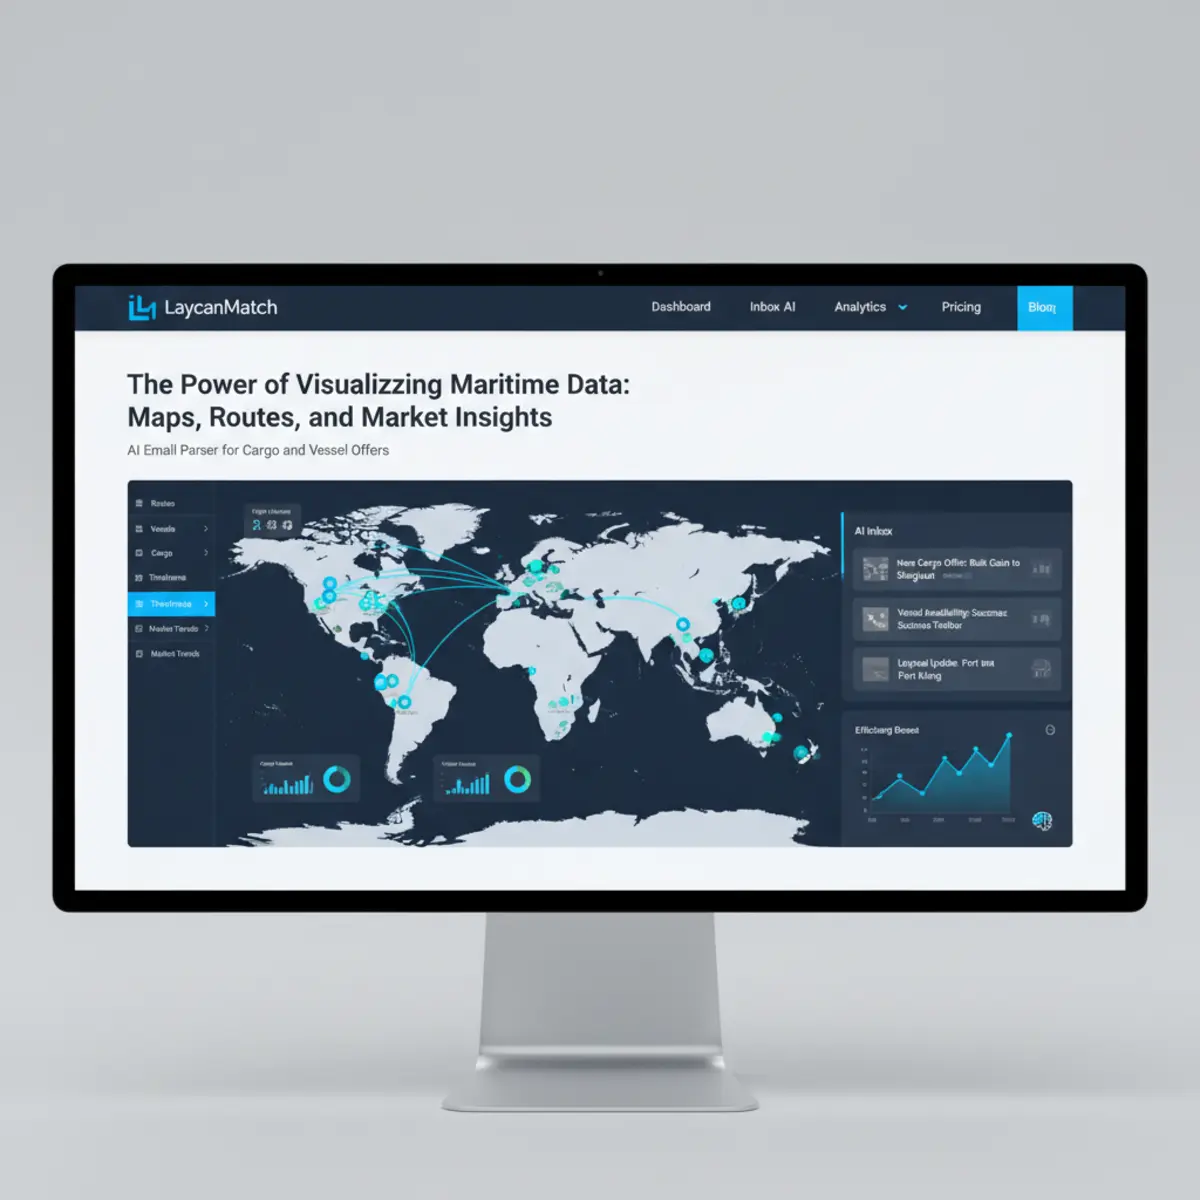
A route map becomes commercially useful only after broker emails are turned into structured data. Once the inbox is parsed into cargo offers, vessel offers, ports and zones, a broker can scan market density faster and decide which leads deserve a closer look.
| Map element | What it helps answer |
|---|---|
| Port groups | Where are the extracted cargoes and vessels clustering? |
| Route lines | Which directional flows are active in the inbox right now? |
| Zone logic | Does the opportunity still fit when exact ports differ? |
| Offer popup | Which cargoes or vessels sit behind that cluster? |
The broker problem
Email data contains route clues, but they are scattered across subject lines, remarks and body text. A broker can know a market well and still lose time scanning which regions have active cargoes, open tonnage or repeated broker coverage.
What changes with structured email processing
Once cargoes and vessel offers are structured, ports and route zones can be visualized. The map becomes a way to scan market density from your own inbox data without opening every offer one by one.
Example workflow
A desk wants to see whether Black Sea to Med cargoes are clustering around a saved vessel position. Instead of re-reading twenty emails, the broker opens the map, sees extracted ports, route lines and grouped offers, then drills into the few that matter.
What LaycanMatch does
LaycanMatch visualizes extracted ports, cargoes, vessels and route lines from processed emails. It helps brokers scan opportunity density and cross-check matches with saved positions and the underlying source email.
What still stays under broker control
The broker still decides whether a route is commercially valid, whether a zone mapping is too broad and which offer deserves a call.