Visualizing Global Maritime Opportunities
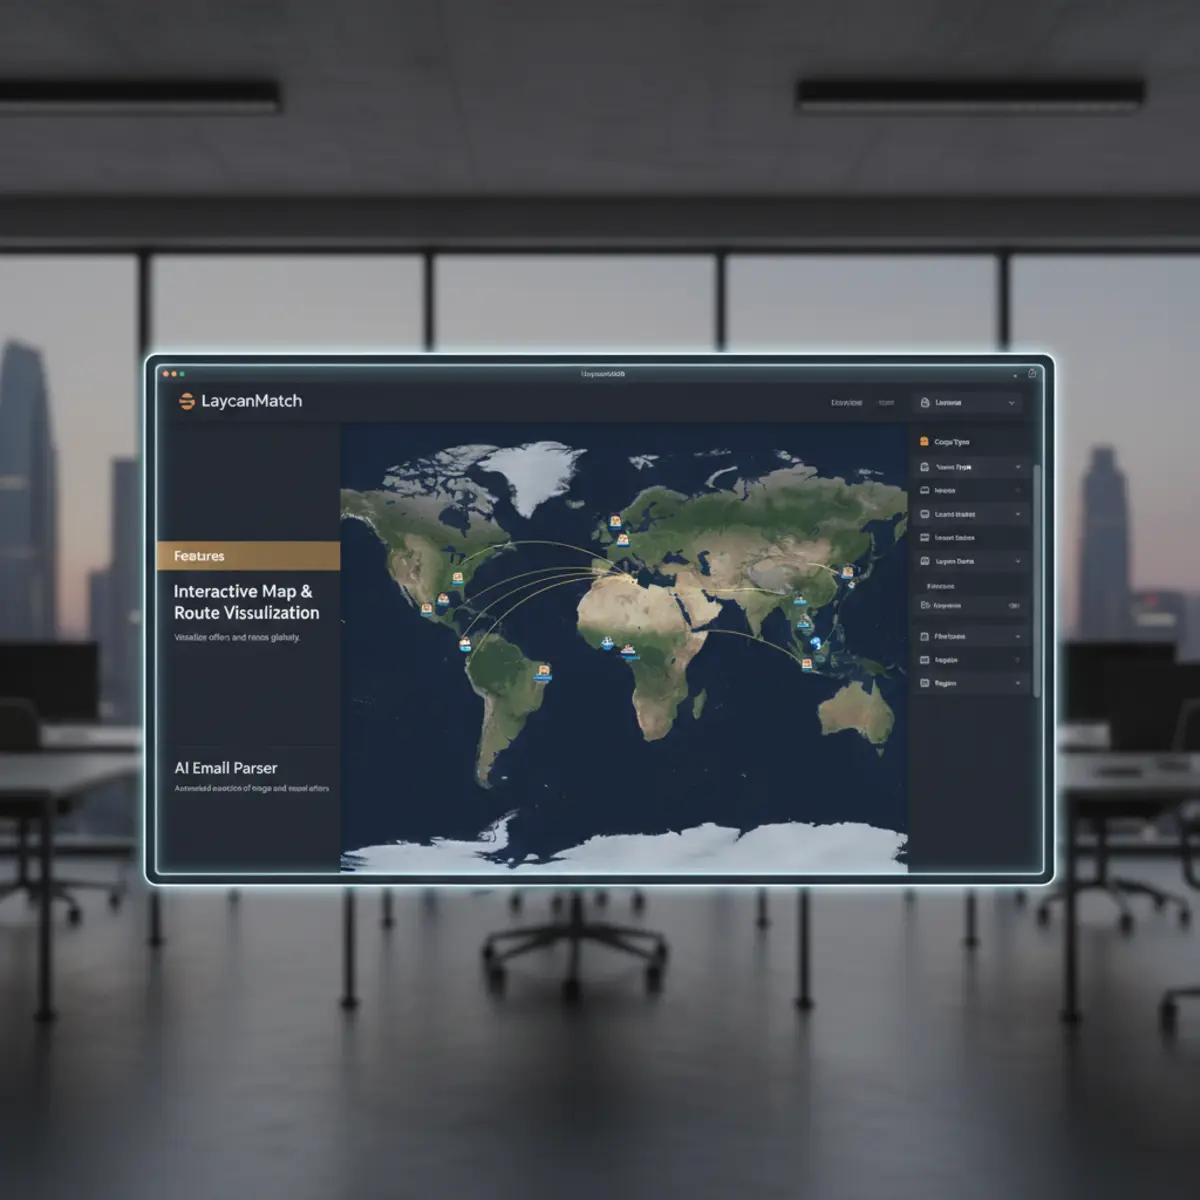
LaycanMatch's Interactive Map & Route Visualization revolutionizes how shipbrokers interact with cargo and vessel offers. By transforming email-extracted data into dynamic visual insights on a global map, brokers gain immediate geographical context for every opportunity. This powerful tool displays real-time vessel positions, cargo origins, destinations, and critical laycan periods, moving beyond text-based data analysis.
It creates a central, intuitive hub where complex maritime information converges, enabling swift identification of optimal matches and potential conflicts, and significantly streamlining the entire maritime logistics process for enhanced efficiency and faster decision-making.
Key Features for Enhanced Maritime Mapping
Our maritime mapping platform provides a comprehensive suite of features tailored for shipbrokers. It includes customizable layers to view different offer types and advanced filtering options by port, region, vessel type, and laycan dates, allowing precise control over displayed information. Dynamic route plotting automatically calculates and visualizes probable routes, distances, and estimated transit times based on selected offers.
The system offers instant route calculation and crucial laycan overlap visualization, identifying conflicts between vessel availability and cargo windows directly on the map. Detailed information pop-ups provide quick access to underlying offer specifics, all within the intuitive map interface, optimizing your workflow.

Streamlined Operations and Efficiency Gains
Integrating LaycanMatch's interactive map visualization into daily operations is seamless, offering immediate and tangible benefits to shipbrokers and chartering managers. The intuitive interface ensures minimal training, allowing teams to quickly leverage visual data for initial offer screening, detailed voyage planning, and comprehensive market analysis. Our automated data mapping feature plots crucial geographical data from emails directly onto the map, eliminating manual entry.
This enhances the overall operational workflow by freeing up valuable time previously spent on tedious data cross-referencing, enabling a more proactive approach to market opportunities and supporting rapid, informed decision-making.
Strategic Decision-Making Through Visual Data
LaycanMatch empowers shipbrokers with profound strategic insights, moving beyond simple matching to facilitate predictive analysis and a deeper understanding of market dynamics. By visualizing historical routes, completed deals, and current market flows, brokers can identify emerging trade lane trends and anticipate future vessel movements. This integrated approach helps in forecasting future opportunities, mitigating potential risks associated with market shifts, and navigating geographical challenges.
The system’s ability to overlay various data points provides a multi-dimensional view essential for comprehensive strategic planning, ensuring brokers maintain a proactive stance in the global shipping market and achieve long-term growth.
Why LaycanMatch's Map Visualization is Indispensable
LaycanMatch's Interactive Map & Route Visualization is crucial for modern shipbroking because it integrates disparate data points into one actionable visual interface, tailored specifically for maritime logistics. Unlike generic mapping tools, it understands the nuances of laycans, vessel types, and global trade lanes, seamlessly integrating with our core functionalities like the searchable offer database.
This holistic approach ensures brokers not only see the data but understand its immediate implications, making every decision more informed and efficient. By leveraging advanced AI for data extraction and visualization, LaycanMatch provides a significant competitive advantage, securing profitable deals faster than traditional methods.